これは黒木玄(@genkuroki)先生の以下のツイートを受けた小ネタです。
https://t.co/ejyfiAN47a#統計 これはいい話を読ませてもらった。
— 黒木玄 Gen Kuroki (@genkuroki) 2018年3月4日
真の分布を含まない確率モデルでのフィッティングでどのように嫌なことが起こるかを知っていることは大事。(←まさにこれに尽きる話題だと思う。)
あと、この手の数値実験はとても楽しいので、みんなで遊んでみるべきだと思う。
元のアイデアとしては、以前の統計モデリングにおける「モデリング手法の選択」談義を踏まえています。
ネタとしては非常に簡単なので、以下にRで書いたコードを並べておきます。冒頭の5つのパラメータと、各種乱数シードを変えれば結果は色々変わるはずです。
# Generate an independent variable: controlled by 5 parameters
> xmin <- 10
> xmax <- 15
> a <- 3
> b <- -2
> s <- 1
> set.seed(71)
> x <- runif(1000, xmin, xmax)

# Generate a dependent variable following Poisson distribution
> set.seed(72)
> t0 <- a*x + b + rnorm(1000, 0, s)
> t <- t0[t0 > 0]
> xt <- x[which(t0 > 0)]
> set.seed(73)
> y0 <- rpois(length(t), t)
> y <- y0[y0 > 0]
> xy <- xt[which(y0 > 0)]

# Split into training and test datasets
> set.seed(74)
> idx <- sample(length(y), 200, replace = F)
> y_train <- y[-idx]
> y_test <- y[idx]
> x <- xy
> x_train <- x[-idx]
> x_test <- x[idx]
> d_train <- data.frame(x = x_train, y = y_train)
> d_test <- data.frame(x = x_test, y = y_test)

# Estimate Poisson GLM, log linear model, and linear model
> d_train.glm <- glm(y ~ x, d_train, family = poisson)
> d_train.log.lm <- lm(log(y) ~ x, d_train)
> d_train.lm <- lm(y ~ x, d_train)
> summary(d_train.glm)

Call:
glm(formula = y ~ x, family = poisson, data = d_train)

Deviance Residuals:
    Min       1Q   Median       3Q      Max
-3.1210  -0.6554  -0.0237   0.6498   2.8284

Coefficients:
            Estimate Std. Error z value Pr(>|z|)
(Intercept)  2.46545    0.05395   45.70   <2e-16 ***
x            0.08702    0.00422   20.62   <2e-16 ***
---
Signif. codes:  0 ‘***’ 0.001 ‘**’ 0.01 ‘*’ 0.05 ‘.’ 0.1 ‘ ’ 1

(Dispersion parameter for poisson family taken to be 1)

    Null deviance: 1227.18  on 799  degrees of freedom
Residual deviance:  800.14  on 798  degrees of freedom
AIC: 5111.4

Number of Fisher Scoring iterations: 4

> summary(d_train.log.lm)

Call:
lm(formula = log(y) ~ x, data = d_train)

Residuals:
    Min      1Q  Median      3Q     Max
-0.7125 -0.1003  0.0104  0.1214  0.4482

Coefficients:
            Estimate Std. Error t value Pr(>|t|)
(Intercept) 2.445086   0.055111   44.37   <2e-16 ***
x           0.087465   0.004369   20.02   <2e-16 ***
---
Signif. codes:  0 ‘***’ 0.001 ‘**’ 0.01 ‘*’ 0.05 ‘.’ 0.1 ‘ ’ 1

Residual standard error: 0.175 on 798 degrees of freedom
Multiple R-squared:  0.3343,	Adjusted R-squared:  0.3334
F-statistic: 400.7 on 1 and 798 DF,  p-value: < 2.2e-16

> summary(d_train.lm)

Call:
lm(formula = y ~ x, data = d_train)

Residuals:
     Min       1Q   Median       3Q      Max
-18.1126  -3.7081  -0.1025   3.9113  17.9683

Coefficients:
            Estimate Std. Error t value Pr(>|t|)
(Intercept)   -3.098      1.867  -1.659   0.0975 .
x              3.063      0.148  20.690   <2e-16 ***
---
Signif. codes:  0 ‘***’ 0.001 ‘**’ 0.01 ‘*’ 0.05 ‘.’ 0.1 ‘ ’ 1

Residual standard error: 5.93 on 798 degrees of freedom
Multiple R-squared:  0.3491,	Adjusted R-squared:  0.3483
F-statistic: 428.1 on 1 and 798 DF,  p-value: < 2.2e-16

# Compute test values and plot them
> pred_glm <- predict(d_train.glm, newdata = d_test, type = 'response')
> pred_log_lm <- predict(d_train.log.lm, newdata = d_test)
> pred_lm <- predict(d_train.lm, newdata = d_test)
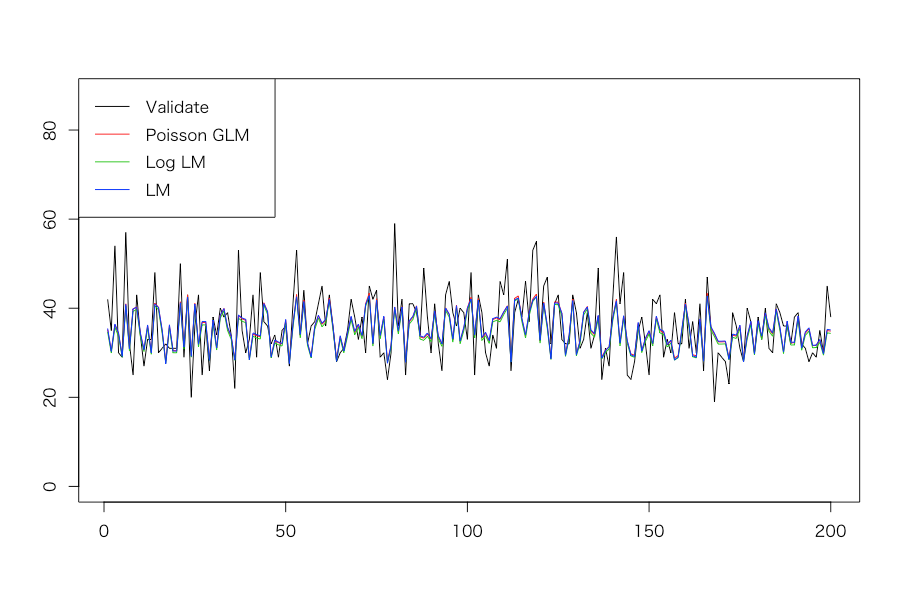
> matplot(cbind(y_test, pred_glm, exp(pred_log_lm), pred_lm), type = 'l', lty = 1, ylab = '', ylim = c(0, round(max(y_test)*1.5, 0)))
> legend('topleft', legend = c('Validate', 'Poisson GLM', 'Log LM', 'LM'), col = c(1, 2, 3, 4), lty = 1)

# Evaluate generalization of each model by RMSE
> sqrt(sum((y_test - pred_glm)^2) / 200)
[1] 5.956725
> sqrt(sum((y_test - exp(pred_log_lm))^2) / 200)
[1] 6.062525
> sqrt(sum((y_test - pred_lm)^2) / 200)
[1] 5.972067

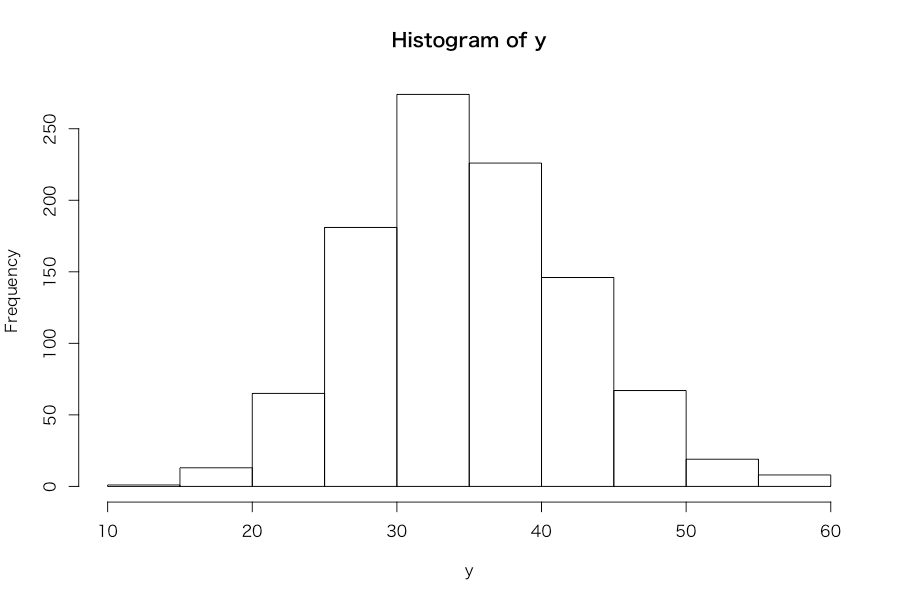
# Draw a histogram of the original y
> hist(y)


ちなみに5つのパラメータをいじると、思った以上に大きく結果が変わり、場合によっては汎化性能の良し悪しの順序が3モデル間で入れ替わることも起きるので、色々試してみると面白そうです。なお、クロスセクションデータ(時系列データではない)なので折れ線プロットをやるのは本当は筋違いなのですが、そこはご容赦くださいということで。。。