正直に白状するとめぼしいお題がなくて記事にするようなものは目下のところ何もないんですが(汗)、最近めっきり多変量データいじらなくなって腕が鈍っている気がしないでもないので、Rの機械学習系のコマンドを打つリハビリ()も兼ねて以前のシリーズの続きをちょっとやってみようと思います。
ということで、お題はUCI Machine Learning Repositoryの"Online News Popularity"です。
データについてはこんな説明書きがついています。
Data Set Information:
- The articles were published by Mashable (www.mashable.com) and their content as the rights to reproduce it belongs to them. Hence, this dataset does not share the original content but some statistics associated with it. The original content be publicly accessed and retrieved using the provided urls.
- Acquisition date: January 8, 2015
- The estimated relative performance values were estimated by the authors using a Random Forest classifier and a rolling windows as assessment method. See their article for more details on how the relative performance values were set.
多分追加されたのは割と最近で、ちょっと前に僕が見た時はまだなかったデータセットかなぁと。そんなわけで、ざっくりこれで遊んでみます。
そうそう、僕はプロのKagglerではないし況んやKaggle Masterとかでも何でもないので、この手のセルフコンペみたいなものをやったところで完全にただの素人芸です(汗)。Kaggle猛者諸氏からのツッコミを心よりお待ちしております。。。
データセットの中身を確認する
ご丁寧にも、各変数については以下の説明がついています。最後の"shares"が目的変数で、58個の説明変数、2個のID系の変数*1から成る、全体で39644行のデータセットです。
Number of Attributes: 61 (58 predictive attributes, 2 non-predictive, 1 goal field)
Attribute Information:
0. url: URL of the article (non-predictive)
1. timedelta: Days between the article publication and the dataset acquisition (non-predictive)
2. n_tokens_title: Number of words in the title
3. n_tokens_content: Number of words in the content
4. n_unique_tokens: Rate of unique words in the content
5. n_non_stop_words: Rate of non-stop words in the content
6. n_non_stop_unique_tokens: Rate of unique non-stop words in the content
7. num_hrefs: Number of links
8. num_self_hrefs: Number of links to other articles published by Mashable
9. num_imgs: Number of images
10. num_videos: Number of videos
11. average_token_length: Average length of the words in the content
12. num_keywords: Number of keywords in the metadata
13. data_channel_is_lifestyle: Is data channel 'Lifestyle'?
14. data_channel_is_entertainment: Is data channel 'Entertainment'?
15. data_channel_is_bus: Is data channel 'Business'?
16. data_channel_is_socmed: Is data channel 'Social Media'?
17. data_channel_is_tech: Is data channel 'Tech'?
18. data_channel_is_world: Is data channel 'World'?
19. kw_min_min: Worst keyword (min. shares)
20. kw_max_min: Worst keyword (max. shares)
21. kw_avg_min: Worst keyword (avg. shares)
22. kw_min_max: Best keyword (min. shares)
23. kw_max_max: Best keyword (max. shares)
24. kw_avg_max: Best keyword (avg. shares)
25. kw_min_avg: Avg. keyword (min. shares)
26. kw_max_avg: Avg. keyword (max. shares)
27. kw_avg_avg: Avg. keyword (avg. shares)
28. self_reference_min_shares: Min. shares of referenced articles in Mashable
29. self_reference_max_shares: Max. shares of referenced articles in Mashable
30. self_reference_avg_sharess: Avg. shares of referenced articles in Mashable
31. weekday_is_monday: Was the article published on a Monday?
32. weekday_is_tuesday: Was the article published on a Tuesday?
33. weekday_is_wednesday: Was the article published on a Wednesday?
34. weekday_is_thursday: Was the article published on a Thursday?
35. weekday_is_friday: Was the article published on a Friday?
36. weekday_is_saturday: Was the article published on a Saturday?
37. weekday_is_sunday: Was the article published on a Sunday?
38. is_weekend: Was the article published on the weekend?
39. LDA_00: Closeness to LDA topic 0
40. LDA_01: Closeness to LDA topic 1
41. LDA_02: Closeness to LDA topic 2
42. LDA_03: Closeness to LDA topic 3
43. LDA_04: Closeness to LDA topic 4
44. global_subjectivity: Text subjectivity
45. global_sentiment_polarity: Text sentiment polarity
46. global_rate_positive_words: Rate of positive words in the content
47. global_rate_negative_words: Rate of negative words in the content
48. rate_positive_words: Rate of positive words among non-neutral tokens
49. rate_negative_words: Rate of negative words among non-neutral tokens
50. avg_positive_polarity: Avg. polarity of positive words
51. min_positive_polarity: Min. polarity of positive words
52. max_positive_polarity: Max. polarity of positive words
53. avg_negative_polarity: Avg. polarity of negative words
54. min_negative_polarity: Min. polarity of negative words
55. max_negative_polarity: Max. polarity of negative words
56. title_subjectivity: Title subjectivity
57. title_sentiment_polarity: Title polarity
58. abs_title_subjectivity: Absolute subjectivity level
59. abs_title_sentiment_polarity: Absolute polarity level
60. shares: Number of shares (target)
UCIのこのデータセットのページには、元となった論文がreferenceとして示されています。しかも、おそらく著者らの厚意で全文が公開されているようです。
これによると、
データセットを読み込んでholdoutを切る
論文中では結構凝ったCVをやっているんですが*2、面倒なので普通にランダムに1000行だけ選び出してテストデータにします。
> d<-read.csv('OnlineNewsPopularity.csv') # 元データを読み込む
> d<-d[,-c(1:2)] # 全く予測と関係ない先頭2列を切る
> idx<-sample(nrow(d),1000,replace = F) # 適当に1000個選ぶ
> train<-d[-idx,] # その1000個以外が学習データ
> test<-d[idx,] # その1000個がテストデータ
とりあえずこれで超いい加減ですがある程度CVできることになりました。
論文の定義に従って二値クラスに分ける
論文をよーーーーーく読むと「shares >= 1400か否かで二値に分けている」と書いてあります。ということでこの閾値に従って二値に分けておきます。
> idxtest<-which(test$shares>=1400) # テストデータの閾値以上の行のインデックスを取得する
> idxtrain<-which(train$shares>=1400) # 学習データの閾値以上の行のインデックスを取得する
# そこでインデックスが得られた行のshares変数には1を割り振る
> test$shares[idxtest]<-1
> train$shares[idxtrain]<-1
# それ以外には0を割り振る
> test$shares[-idxtest]<-0
> train$shares[-idxtrain]<-0
# classificationするのでfactor型に直す
> test$shares<-as.factor(test$shares)
> train$shares<-as.factor(train$shares)
> summary(train$shares)
    0     1
18013 20631
> summary(test$shares)
  0   1
477 523
# それほど不均衡データにはなっていない
ついでに確認した結果からは、極端な不均衡データではないことが分かります。ということで、普通に分類器に突っ込めば良さそうですね。
とりあえず何も考えずにランダムフォレストで分類してみる
一応、論文中ではランダムフォレストがベストパフォーマンスを叩き出したらしいので、普通にランダムフォレストでやってみます。
> library(randomForest)
# tuneRFでチューニングしようと思ったが重たいので諦めた
> train.rf<-randomForest(shares~.,train)
> table(test$shares,predict(train.rf,newdata=test[,-59]))

      0   1
  0 284 193
  1 141 382
> sum(diag(table(test$shares,predict(train.rf,newdata=test[,-59]))))/nrow(test)
[1] 0.665
大体論文のパフォーマンスと同じくらいになりました。ついでに変数重要度をチェックしてみるとこうなります。
> importance(train.rf)
                              MeanDecreaseGini
n_tokens_title                       301.60380
n_tokens_content                     452.82860
n_unique_tokens                      496.56542
n_non_stop_words                     452.90013
n_non_stop_unique_tokens             501.61029
num_hrefs                            398.84016
num_self_hrefs                       240.06761
num_imgs                             267.22725
num_videos                           151.82728
average_token_length                 499.90676
num_keywords                         194.55186
data_channel_is_lifestyle             31.31140
data_channel_is_entertainment        172.38185
data_channel_is_bus                   41.84259
data_channel_is_socmed               103.61536
data_channel_is_tech                 100.78584
data_channel_is_world                120.32010
kw_min_min                           110.51764
kw_max_min                           482.66542
kw_avg_min                           547.94047
kw_min_max                           315.87118
kw_max_max                           142.85489
kw_avg_max                           552.27383
kw_min_avg                           421.79427
kw_max_avg                           753.21509
kw_avg_avg                           842.36403
self_reference_min_shares            572.85719
self_reference_max_shares            446.36563
self_reference_avg_sharess           551.66169
weekday_is_monday                     55.22746
weekday_is_tuesday                    61.33571
weekday_is_wednesday                  61.71977
weekday_is_thursday                   57.80722
weekday_is_friday                     55.17558
weekday_is_saturday                   83.72945
weekday_is_sunday                     52.87669
is_weekend                           197.54906
LDA_00                               549.62799
LDA_01                               564.14574
LDA_02                               620.76406
LDA_03                               512.33607
LDA_04                               570.96284
global_subjectivity                  511.57444
global_sentiment_polarity            464.66297
global_rate_positive_words           485.41044
global_rate_negative_words           434.12129
rate_positive_words                  383.37487
rate_negative_words                  387.98007
avg_positive_polarity                472.52093
min_positive_polarity                232.29358
max_positive_polarity                194.28895
avg_negative_polarity                443.71454
min_negative_polarity                268.40594
max_negative_polarity                258.10739
title_subjectivity                   244.11502
title_sentiment_polarity             280.16476
abs_title_subjectivity               225.20669
abs_title_sentiment_polarity         223.03469
思ったほど突出して効いている説明変数がなくて、どれもどんぐりの背比べ感が否めない印象です。
L1正則化で説明変数を絞ってみる
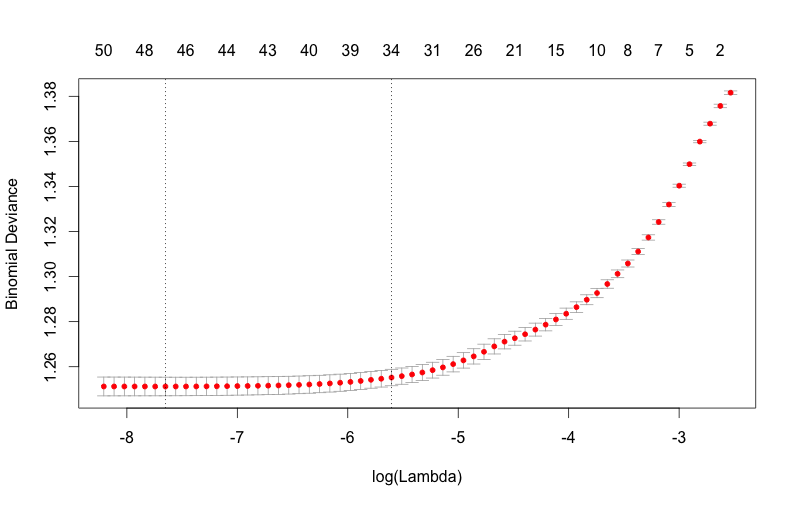
とは言え、とりあえずザッと説明変数のリストを見た感じ要らないっぽいものがチラホラ目に付くので削ってみたいなぁという気がどうしてもしてくるので、削ってみます。削るならやっぱりL1正則化でしょう!ということで、{glmnet}を使って削っていきます。
> library(glmnet)
> train.glmnet<-cv.glmnet(as.matrix(train[,-59]),as.integer(train$shares)-1,family='binomial',alpha=1)
> plot(train.glmnet)
> coef(train.glmnet,s=train.glmnet$lambda.min)
59 x 1 sparse Matrix of class "dgCMatrix"
                                          1
(Intercept)                   -1.924417e+00
n_tokens_title                 .
n_tokens_content               1.972370e-04
n_unique_tokens                .
n_non_stop_words               2.941005e-03
n_non_stop_unique_tokens       .
num_hrefs                      9.037775e-03
num_self_hrefs                -1.790393e-02
num_imgs                       3.499607e-03
num_videos                     .
average_token_length          -7.447395e-02
num_keywords                   4.426964e-02
data_channel_is_lifestyle     -8.967123e-02
data_channel_is_entertainment -2.953811e-01
data_channel_is_bus           -1.687054e-01
data_channel_is_socmed         8.671045e-01
data_channel_is_tech           5.293815e-01
data_channel_is_world          1.017137e-02
kw_min_min                     1.909228e-03
kw_max_min                     .
kw_avg_min                    -2.538994e-05
kw_min_max                    -6.403865e-07
kw_max_max                    -2.614637e-07
kw_avg_max                    -4.457514e-07
kw_min_avg                    -7.074622e-05
kw_max_avg                    -8.082924e-05
kw_avg_avg                     6.601764e-04
self_reference_min_shares      3.944261e-06
self_reference_max_shares      3.354461e-07
self_reference_avg_sharess     2.723112e-06
weekday_is_monday              6.251897e-02
weekday_is_tuesday            -5.320896e-02
weekday_is_wednesday          -5.494586e-02
weekday_is_thursday            .
weekday_is_friday              1.890105e-01
weekday_is_saturday            2.282464e-01
weekday_is_sunday              .
is_weekend                     7.988921e-01
LDA_00                         9.498490e-01
LDA_01                        -5.867889e-02
LDA_02                        -2.031662e-01
LDA_03                         .
LDA_04                         4.349305e-01
global_subjectivity            9.854330e-01
global_sentiment_polarity      .
global_rate_positive_words    -2.903276e+00
global_rate_negative_words     2.638985e+00
rate_positive_words            7.316597e-03
rate_negative_words           -3.964221e-01
avg_positive_polarity         -2.302301e-01
min_positive_polarity         -6.519552e-01
max_positive_polarity          .
avg_negative_polarity          .
min_negative_polarity          1.215278e-02
max_negative_polarity          2.914200e-02
title_subjectivity             9.290800e-02
title_sentiment_polarity       1.924013e-01
abs_title_subjectivity         2.400618e-01
abs_title_sentiment_polarity   1.569691e-02

> tmp<-coef(train.glmnet,s=train.glmnet$lambda.min)
> train.l1<-train[,c(tmp@i,59)]
> test.l1<-test[,c(tmp@i,59)]

これで11個ほど説明変数を削れたので、ランダムフォレストでやり直してみます。
> train.l1.rf<-randomForest(shares~.,train.l1)
> table(test.l1$shares,predict(train.l1.rf,newdata=test.l1[,-48]))

      0   1
  0 283 194
  1 149 374
> sum(diag(table(test.l1$shares,predict(train.l1.rf,newdata=test.l1[,-48]))))/nrow(test.l1)
[1] 0.657
悪化しましたorz ちなみに上の方でL1正則化したロジスティック回帰モデルをそのままテストデータへの予測に使うとこうなります。
> table(test$shares,round(predict(train.glmnet,newx=as.matrix(test[,-59]),s=train.glmnet$lambda.min,type='response'),0))

      0   1
  0 291 186
  1 164 359
> sum(diag(table(test$shares,round(predict(train.glmnet,newx=as.matrix(test[,-59]),s=train.glmnet$lambda.min,type='response'),0))))/nrow(test)
[1] 0.65
うーむ。。。L1正則化ロジスティック回帰ではこれぐらいが限界のようです。
xgboostでやってみる
だったら、Kaggleで大人気のxgboostを使ってみるのも一手かなと。ちなみに手法について解説した過去記事はこちら。
ということでスクリプトは以下の通り。
> library(xgboost)
> library(Matrix)
> train.mx<-sparse.model.matrix(shares~.,train)
> test.mx<-sparse.model.matrix(shares~.,test)
> dtrain<-xgb.DMatrix(train.mx,label=as.integer(train$shares)-1)
> dtest<-xgb.DMatrix(test.mx,label=as.integer(test$shares)-1)
> set.seed(71) # 何度かここで試行錯誤している
> train.gbdt<-xgb.train(params=list(objective='binary:logistic',eta=0.4),data=dtrain,nrounds=9,watchlist=list(train=dtrain,test=dtest))
> sum(diag(table(test$shares,round(predict(train.gbdt,newdata=dtest),0))))/nrow(test)
[1] 0.668 # ベストパフォーマンス

> train.l1.mx<-sparse.model.matrix(shares~.,train.l1)
> test.l1.mx<-sparse.model.matrix(shares~.,test.l1)
> dtrain.l1<-xgb.DMatrix(train.l1.mx,label=as.integer(train.l1$shares)-1)
> dtest.l1<-xgb.DMatrix(test.l1.mx,label=as.integer(test.l1$shares)-1)
> train.l1.gbdt<-xgb.train(params=list(objective='binary:logistic',eta=0.3),data=dtrain.l1,nrounds=15,watchlist=list(train=dtrain.l1,test=dtest.l1))
> sum(diag(table(test.l1$shares,round(predict(train.l1.gbdt,newdata=dtest.l1),0))))/nrow(test)
[1] 0.667
ということで、全ての説明変数を入れてxgboostで分類した時に論文とほぼ同じaccuracy = 0.668というパフォーマンスに達しました。論文中では他にもAdaBoostとかSVMとかkNNとかナイーブベイズとか挙げられてますが、ここでは割愛します。
他の考え方
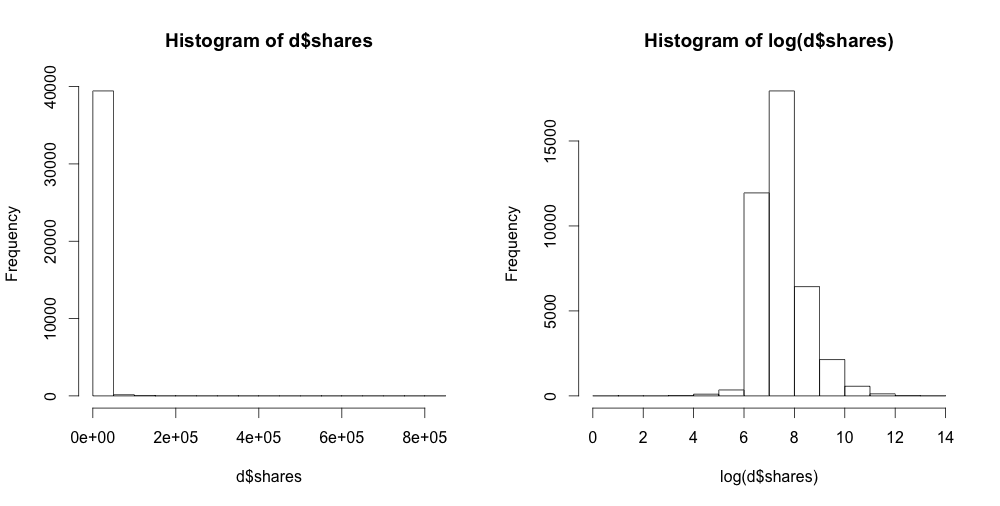
そもそもsharesは連続値なので、回帰すればええやんと最初思ったのでした。普通に線形回帰するとめちゃくちゃな結果になるのですが、生のデータを見てみると
> summary(d$shares)
   Min. 1st Qu.  Median    Mean 3rd Qu.    Max.
      1     946    1400    3395    2800  843300
> par(mfrow=c(1,2))
> hist(d$shares)
> hist(log(d$shares))

ということで対数変換すればsharesの分布が正規分布に近くなり、それなりのスコアになるであろうことが予想されます。また、実際適当に回帰してみて単純に相関係数を計算するとr = 0.4ぐらいになります。なのですが、これを評価するにはRMSEとかになってなかなか論文の見た目としては評価しづらくなるので、それで1400とかいう閾値を切って二値分類にしたのかなぁ、と。。。ちなみに回帰して予測した結果を閾値1400で切って二値に直してconfusion matrixを書くと、accuracy = 0.665ぐらいになってました。
そんなわけで、論文のスコアを上回ることはできませんでしたorz 簡単そうに見えたんですが、意外と難しいんですねぇ。。。ということでお後がよろしいようで。